
The Analytics page allows you to view various metrics relating to your Conversation API apps.
To access the Analytics page:
- Log in to the Sinch Build Dashboard.
-
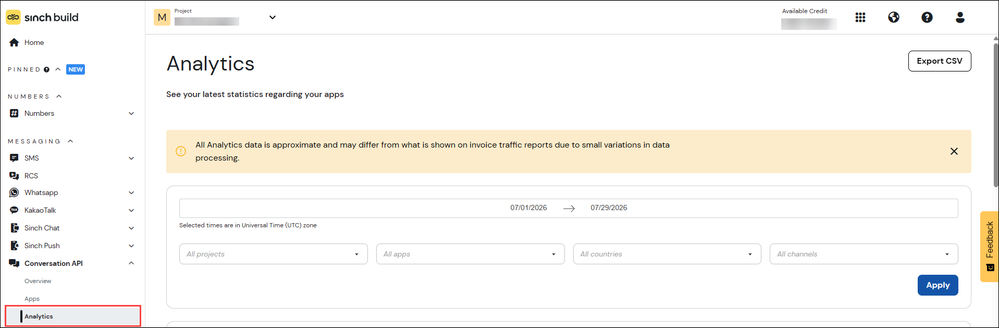
Select Conversation API from the left menu and select the Analytics option. The Analytics page is displayed:
- You can filter the available data by time frame, projects, apps, countries and channels. Make your selections and click Apply.
A series of reports are displayed which show the corresponding data. These include:
- A general message data report
- MAU
- WhatsApp - Service conversations
- Number of Conversations
- Channel distribution - All Successful Messages (Sent & Received)
- Message status - Submitted Messages (MTs)
- Top 5 - Countries
- Top 5 - Apps
- Top 5 errors
- Top 5 failing apps.
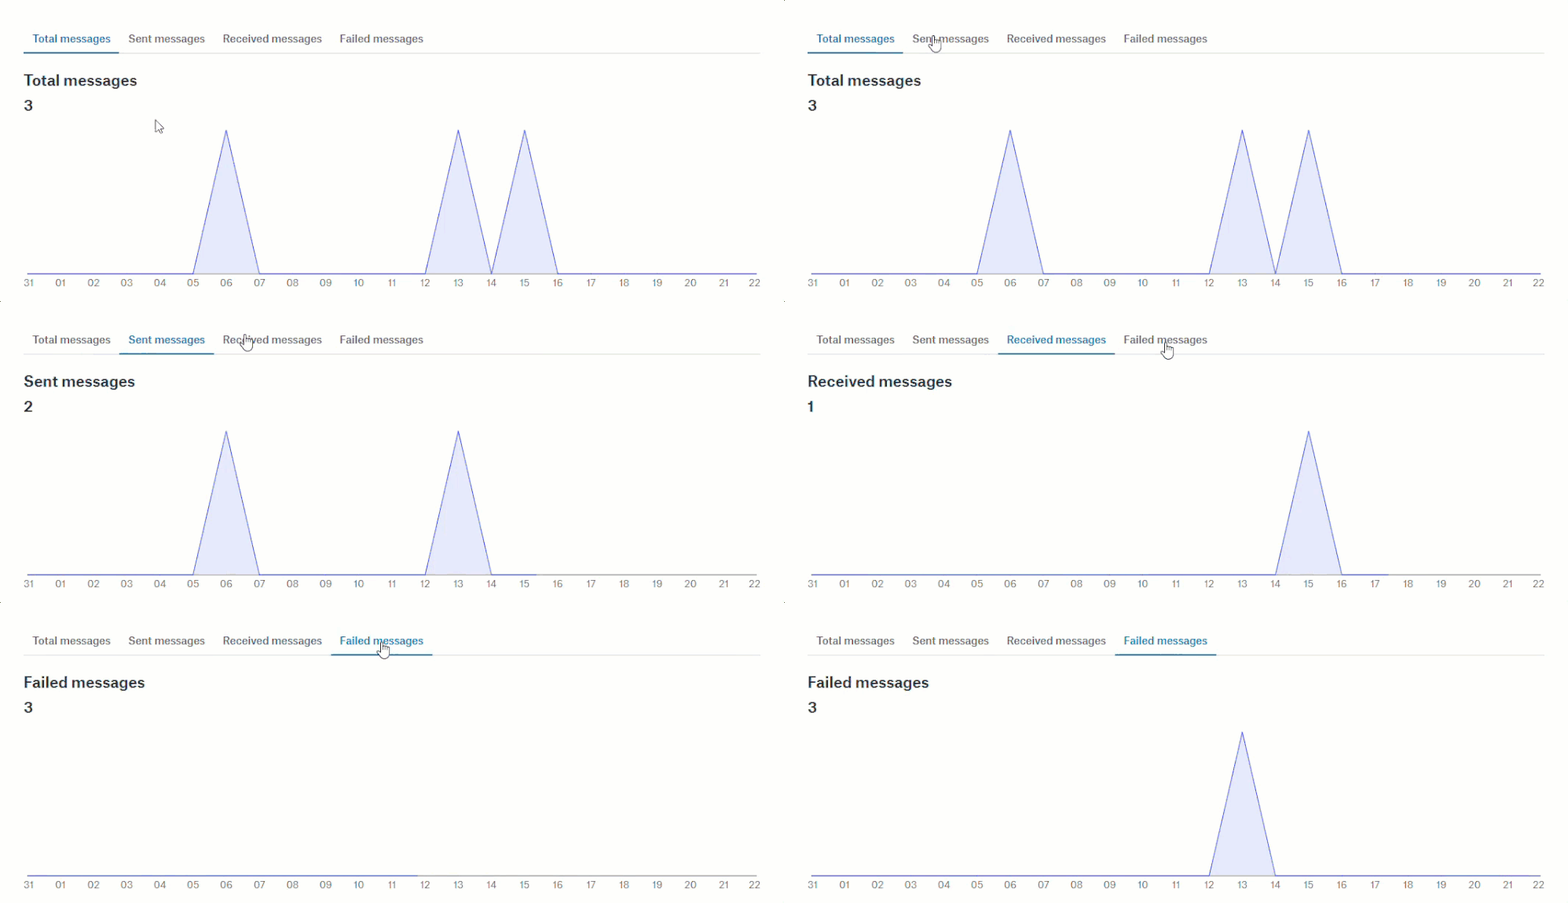
For example, the general message data report shows you the numbers of messages that were sent, received, or failed by day in the specified time frame:
Export CSV
To export all the message data to a CSV file, click Export CSV in the top left corner of the page.
Comments
0 comments
Please sign in to leave a comment.